Technology & Tools
Online Reporting Tool
Our online reporting tool allows Irwin Broh Research to provide clients with survey results integrated with other company data in a visual format. The software visualizes and distributes data into existing reporting templates that can be updated in real time as surveys are completed. It enables clients to deploy dynamic marketing dashboards to different user groups, with log-in passwords acting as a gatekeeper for who can see what. Multiple filters can be employed to easily access data by product types, sales territories, customer groups, etc.
Drill-down tools allow for unlimited cross-tab capability, and verbatim comment logic on open-end questions gives structure to qualitative responses. User access logs provide clear summaries for who is using the dashboard and what sites are being accessed.
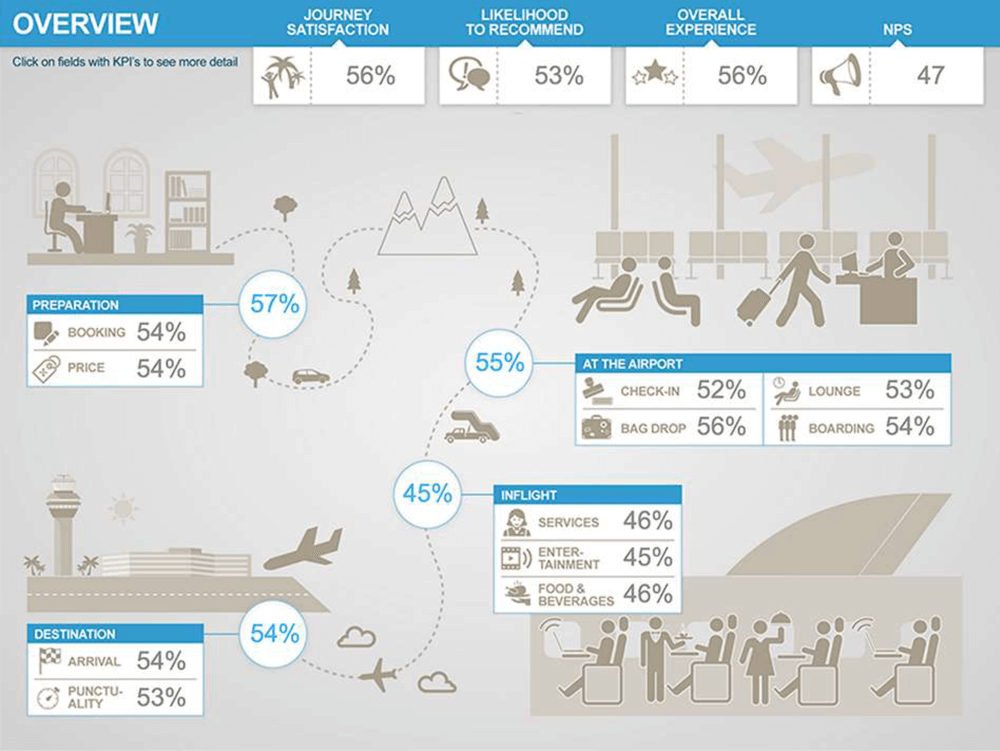
Path to Purchase
Survey data can be displayed chronologically showing key satisfaction metrics at various customer touch points, with callouts at the top of the page for corporate goals.
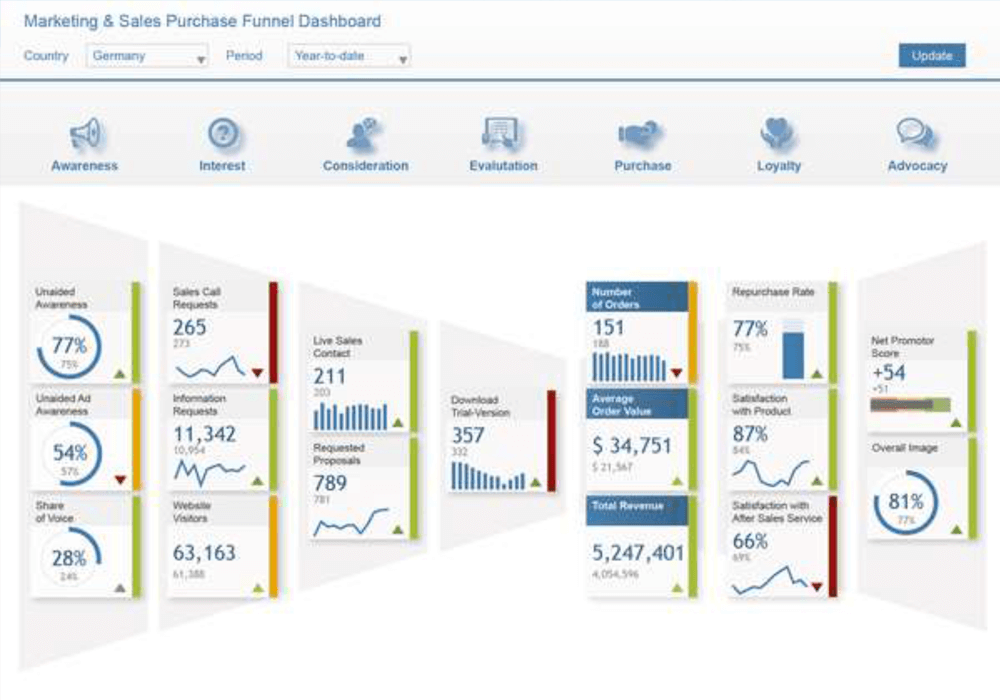
Purchase Funnel
From a prospect to a customer to an advocate, survey data is summarized to show key metrics of the customer life cycle.
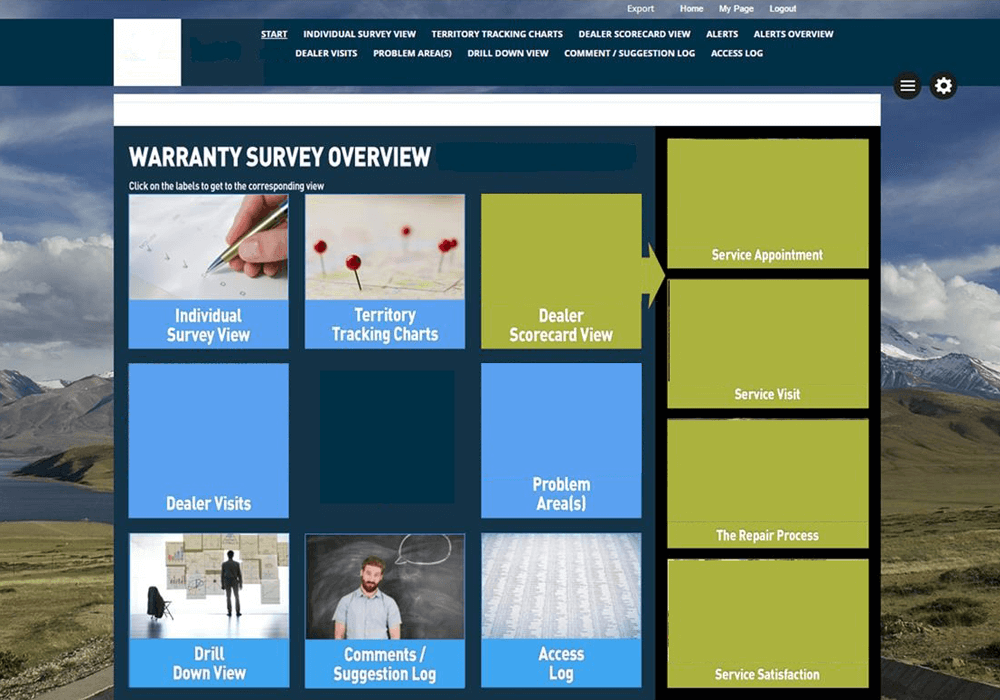
Warranty Survey Overview
Survey data can be viewed individually or aggregated into various areas of interest or for different user groups. Common aggregations are by dealer/retailer or by sales territory. In each case, aggregated data or scores for respondent sub-groups scores can be compared to a national average or measure progress toward a goal.
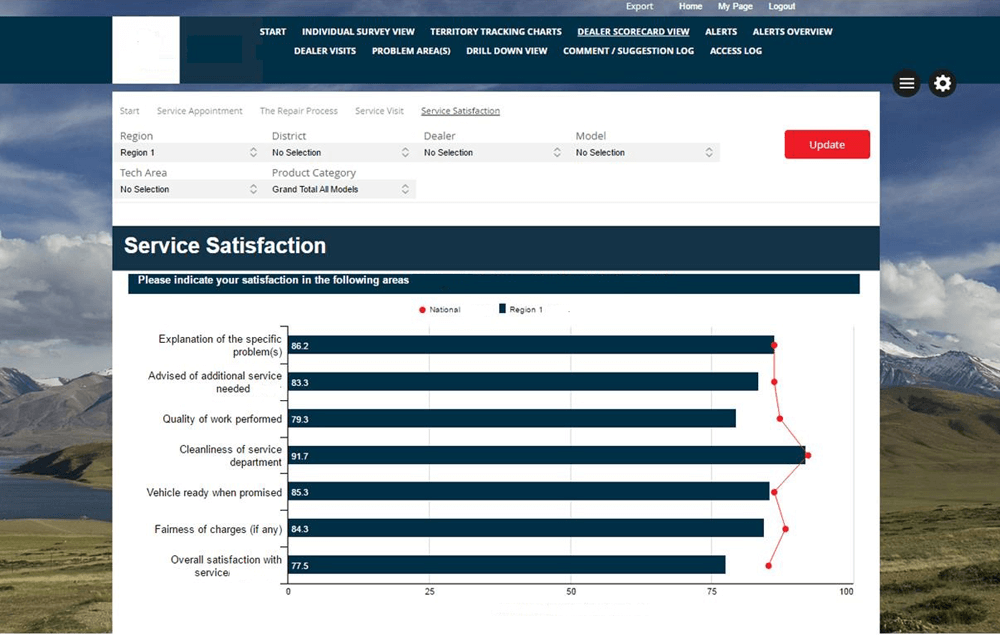
Service Satisfaction
Getting into detail on a key customer touch point like a service visit, data is displayed for a selected respondent subgroup compared to the national average. Filters at the top allow for easy selection of a target constituency.
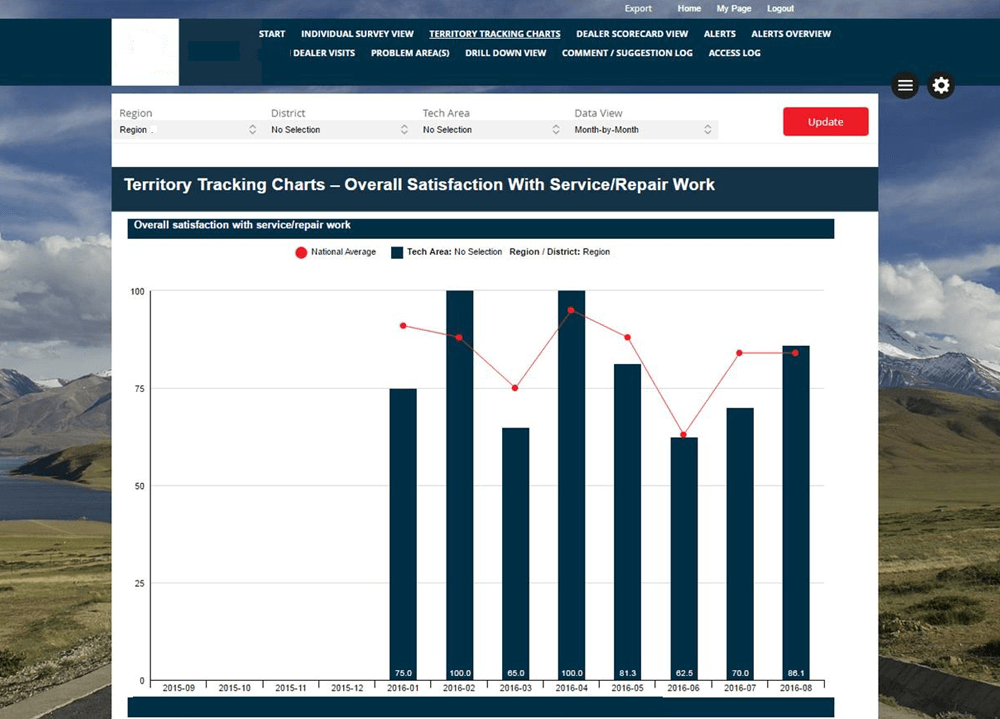
Territory Tracking Charts
Key survey metrics can be viewed overall for a selected time period, or tracked month by month to view progress over time. Monthly data can be viewed in separate blocks or as a 12-month rolling average.
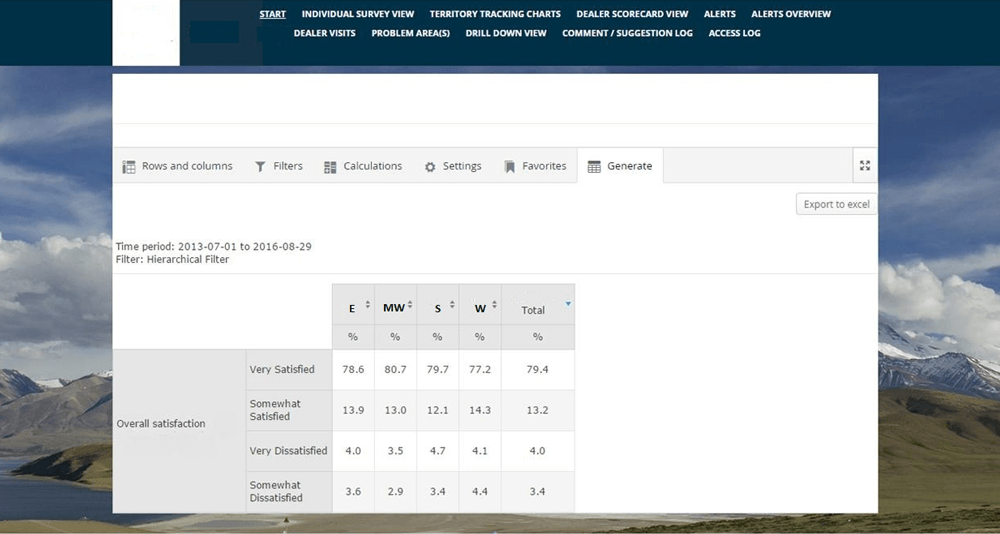
Drill Down Tool
The program includes a simple-to-use drill down tool where any question can be crossed against any other question. Simply select the ROW and COLUMN questions from a drop-down list. Statistic and calculation settings allow for advanced data mining and significance testing.
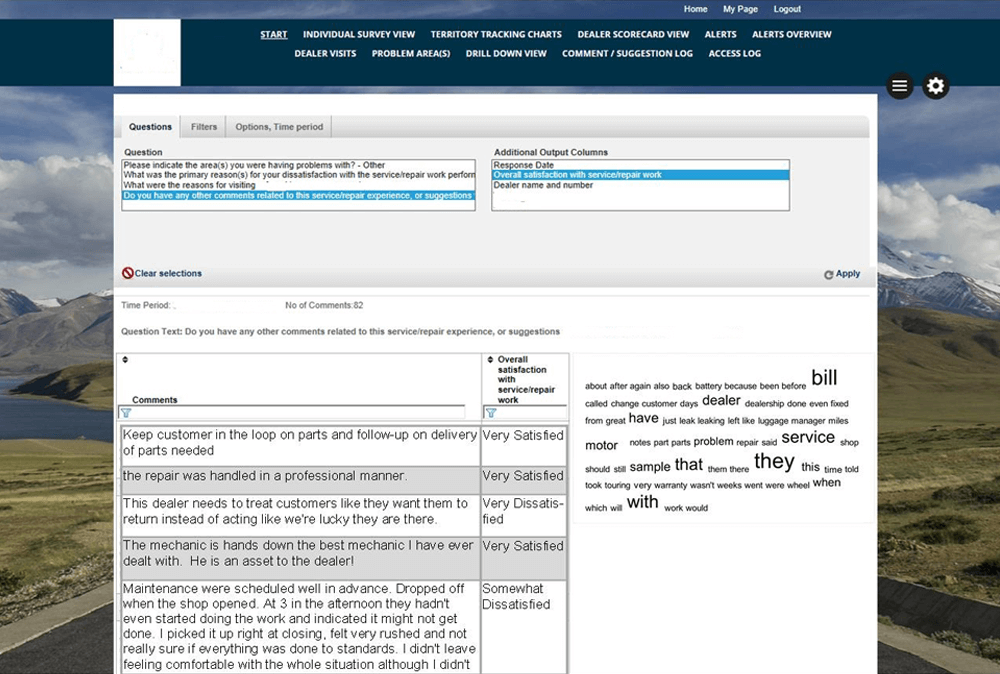
Verbatim Open Ends
The program also organizes and displays the verbatim answers to open-end questions. They can be called up by product model, level of satisfaction, type of problem, etc. Results from any of the filter settings can be shown in a word cloud that graphically displays the frequency of key words used by respondents.